6 Reasons to Use Excel Table Functionality
- By Ellen Smith
- •
- 21 Dec, 2015
- •
This article applies to Microsoft Excel 2007, 2010, 2013 and 2016
Often when people tell us they are having problems getting
the reports they want from their Excel logs or tracking sheets, the heart of
the problem rests with the starting point, the source data, and in particular
the way it’s laid out. They are keen to
make the initial data clear and easy to read but also want to be able to
manipulate the data and get answers fast.
With Excel’s Table functionality your data can still look good and be manipulated and analysed quickly.
Here are six good reasons to try this technique.
1. Clarity
2. Integrated sorting and filtering
3. Headings that are always visible
4. Simple selection and navigation
5. Dynamic data range
6. Automatic analysis
What do you need to get started?
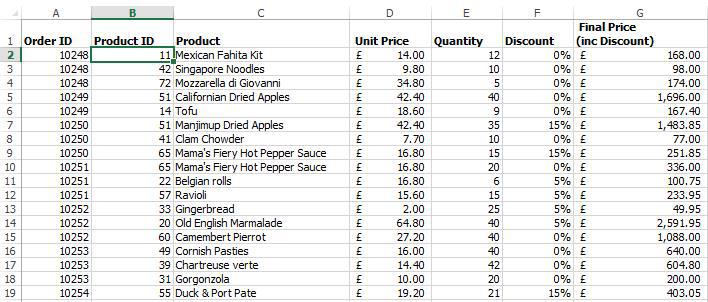
The easiest approach is to keep the initial information in a simple table layout with the headings in the first row and data entered consistently in each column.
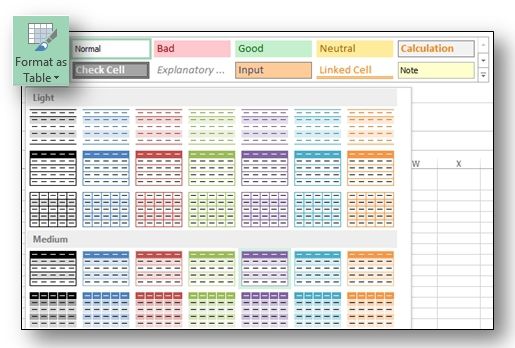
Select a cell in the table of data you have created or imported. Click on the Format as Table button on the Home tab and choose a table style from the list of options.
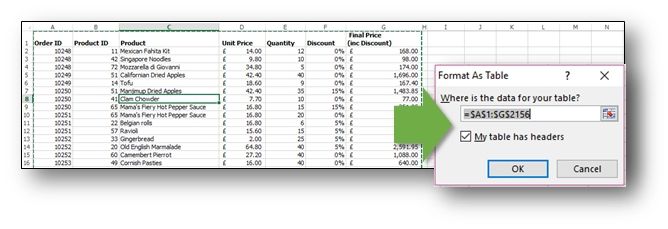
Once you have chosen a style for your table, The Format as Table box will appear. Notice the range is automatically selected and that Excel is working on the basis that your headings are in the first row of the data. Click on OK to convert the data range to a “table”.
1. Clarity
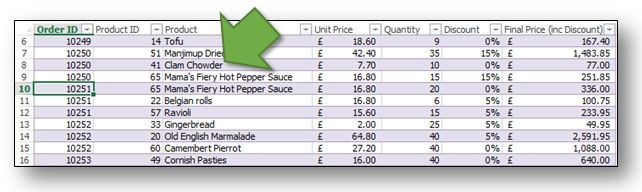
When you use the “Format as Table” command you get to choose a table style which incorporates options like banded rows, a format which shades alternate rows, making it easier for the reader to distinguish one record from another. And there’s more! When you insert or remove a row (or column) in your table, Excel automatically adjusts the formatting which means the alternate shading is always consistent. Are you sold yet?
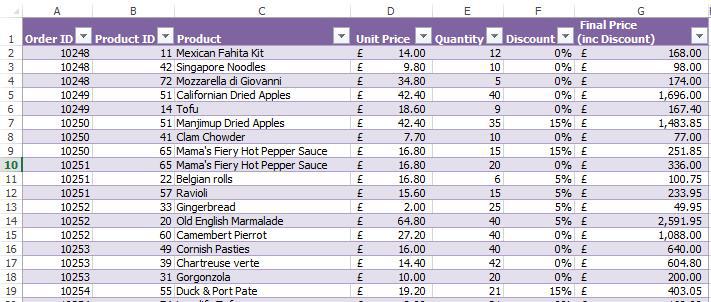
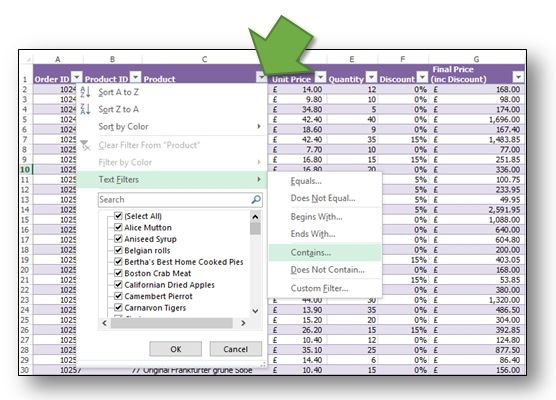
2. Integrated sorting and filtering
The combined sort and filter functionality becomes automatically available when you format your data as a table. So you can start to organise and query your data with a couple of mouse clicks.
3. Headings that are always visible
Gone are the days of having to “Freeze Panes” (well almost!). The “Format as Table” command automatically recognises the first row of your table as headings and fixes them at the top of the screen as you scroll down.
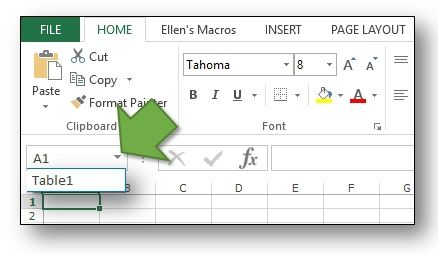
4. Simple selection and navigation
Each block of data that you format in this way is given an automatic name: for example Table1 or Table2. This name is accessible from the Name box, located at the top left-hand side of the screen, which means whichever sheet you are in, you can always navigate to, select or reference this area with that name and - yes - you can change the name if you want to!
5. Dynamic Data Range
When you add a column or row to the edge of data that has been “Formatted as a Table”, this new data is automatically included in the table layout and in the range referenced by the table name we mentioned in point four. This is Excel “heaven” for anyone who has resorted to writing macros in the past, or battled with the OFFSET function, to ensure that their PivotTable Report, Chart or VLOOKUP function remains up-to-date as the data source changes.
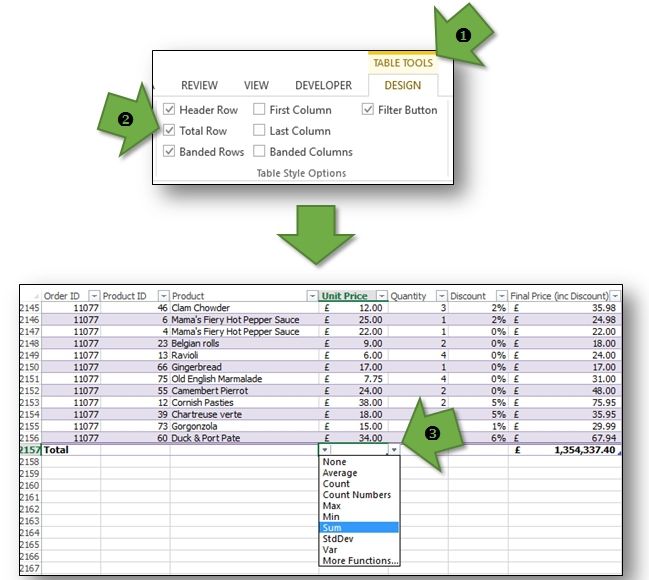
6. Automatic Analysis
You can add a total row to any table which enables you to quickly select from a range of options providing instant results such as totals, averages and the number of items in a column. What’s more, these results automatically adjust as you filter the information in your table.
It really is as easy as 1 2 3!
If you like the story so far, our experts can show you how to: apply this functionality to your data; handle duplicates; reference cells in a table for linking and calculation purposes; summarize data using PivotTable reports or use Excel to manipulate external data. Contact our team and select the right training option for you.


What is Individual Coaching?
For many individuals, group development coaching is not appropriate for addressing their specific needs within the business, particularly if they hold senior positions with a lot of responsibility. In order to maximise the value and talent that these employees can bring to the company, a one-to-one relationship, completely bespoke to their requirements is essential. Individual coaching responds to them as they outline personal and business goals and challenges, addressing key concerns and constantly reviewing progress.

Here are five top tips to help you do this quickly and easily.
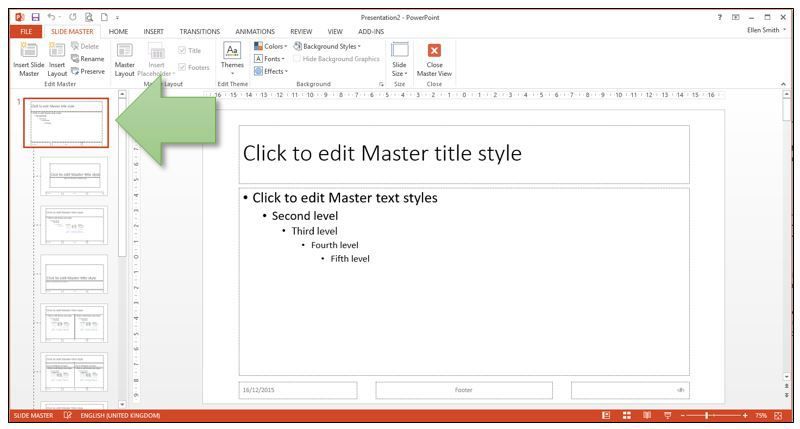
1. Invest time to save time - use the right theme/template
Begin by creating a new presentation based on your company’s theme/template where appropriate. This is key as it will provide your future work with a consistent look and save you valuable time if you need to copy slides from one presentation to another (see point 3 for more on this). Additionally, when other users are involved in customising or re-creating presentations, it ensures you retain a consistent look and can produce tailored content fast!
Along with the new website, you may be aware that we have unveiled a new brand for the company which has given us a fresh new look, fit for the modern technological age and symbolises our continued commitment to the development of our clients. We'll also be expanding our presence on social media networks so watch this space!
As we move on from our old logo, we look ahead with an abundance of positivity to running even more training sessions for our growing list of fantastic clients. We thank you for your on-going referrals and here's to helping you and your teams to develop and become even more effective with the software at your disposal!